Usage Monitoring
The usage monitoring page allows you to have a better view of the usage of the application within your factory.
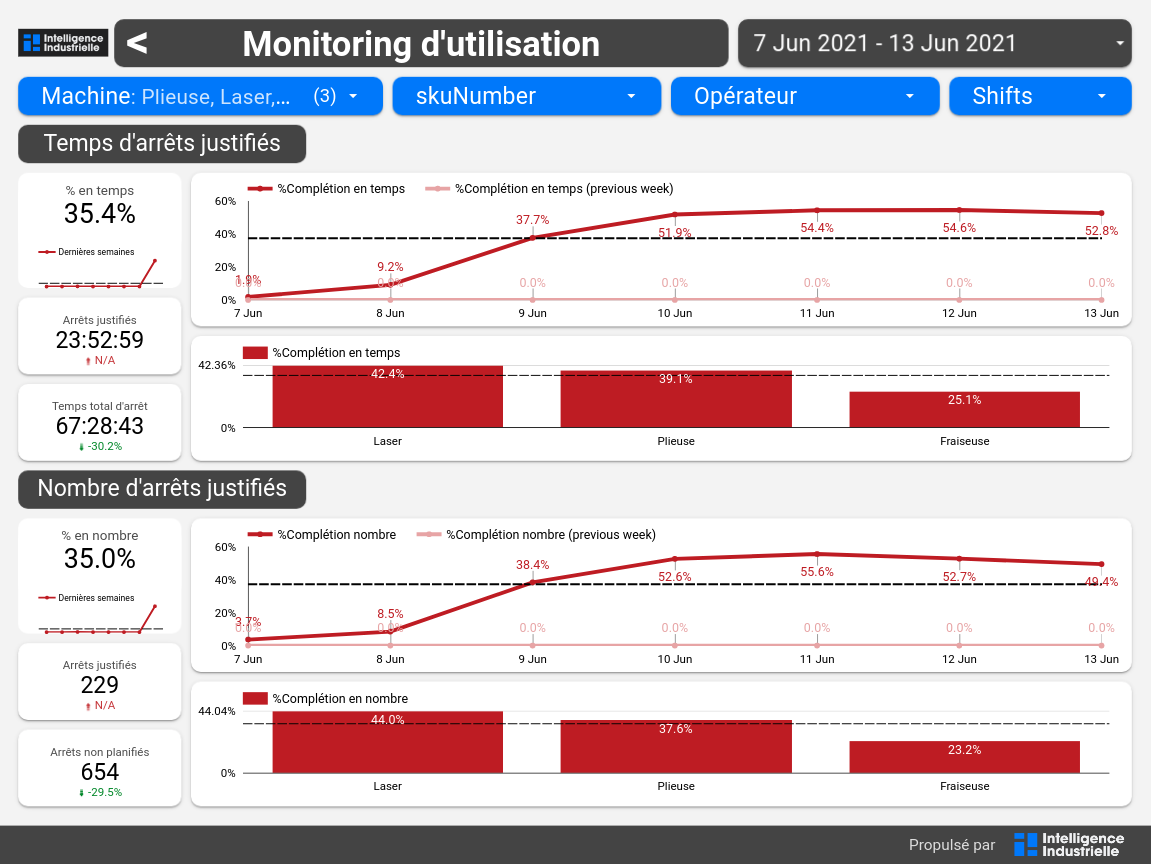
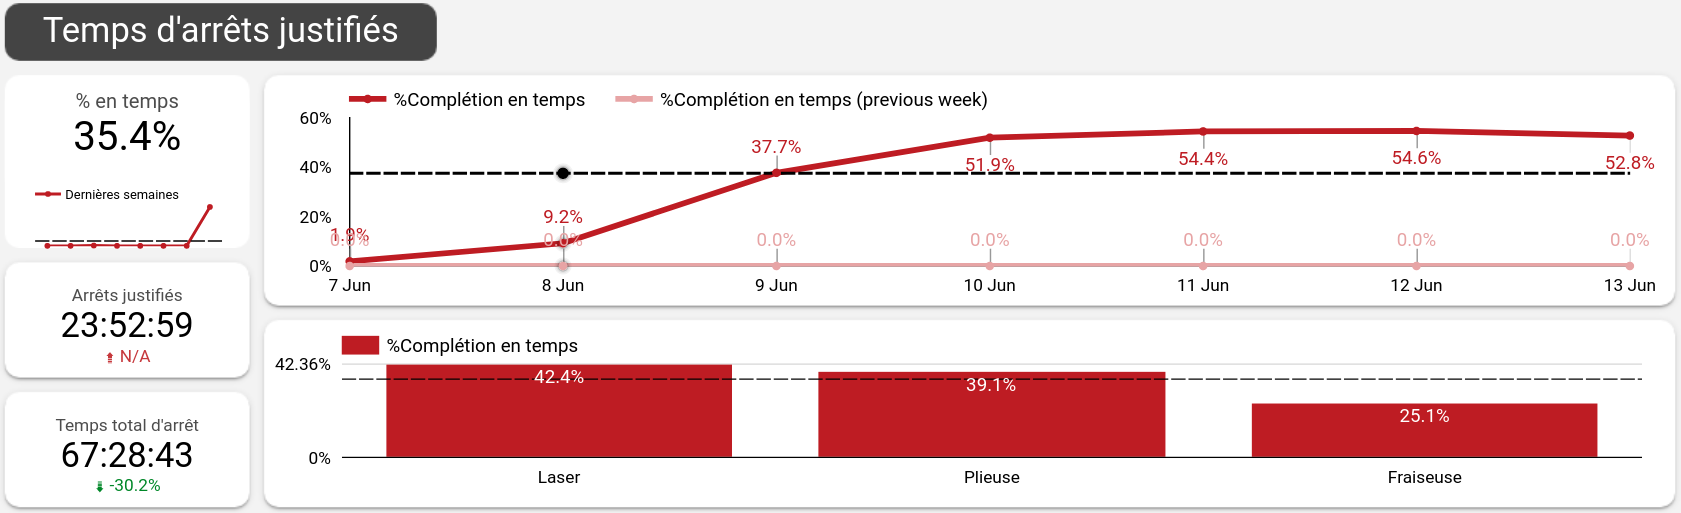
In the top part, the usage is defined in time. There are three indicators on the left:
- The ratio of downtime filled with a stop cause on the total downtime
- The amount of downtime filled with a stop cause
- The total downtime
In the bottom part, the usage is defined in the number of occurences of downtime. There are three indicators on the left:
- The percentage of the number of stops filled with a stop cause on the total number of stops
- The number of stops filled with a stop cause
- The total number of stops
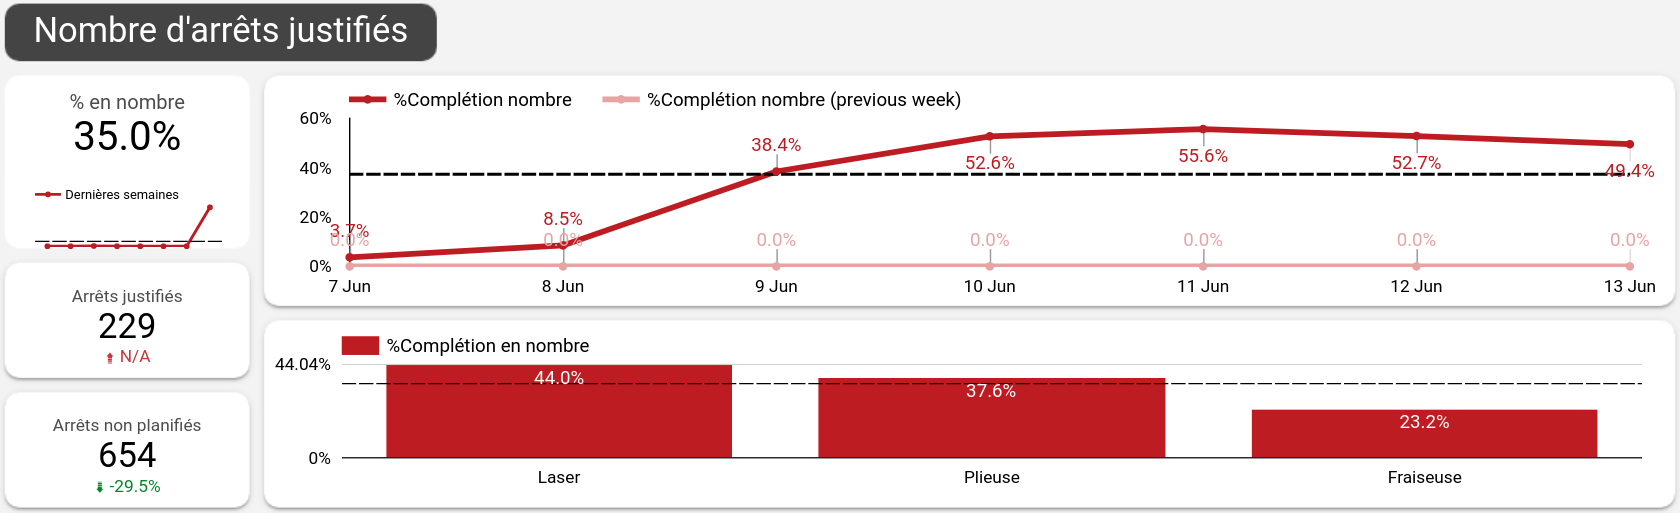
In each section, the first graph shows the evolution of the ratio for each day and the second graph shows the ratio for each machine.