Stops Study
The detailed stops study page allows you to have a better view of the downtime that occured in your factory.
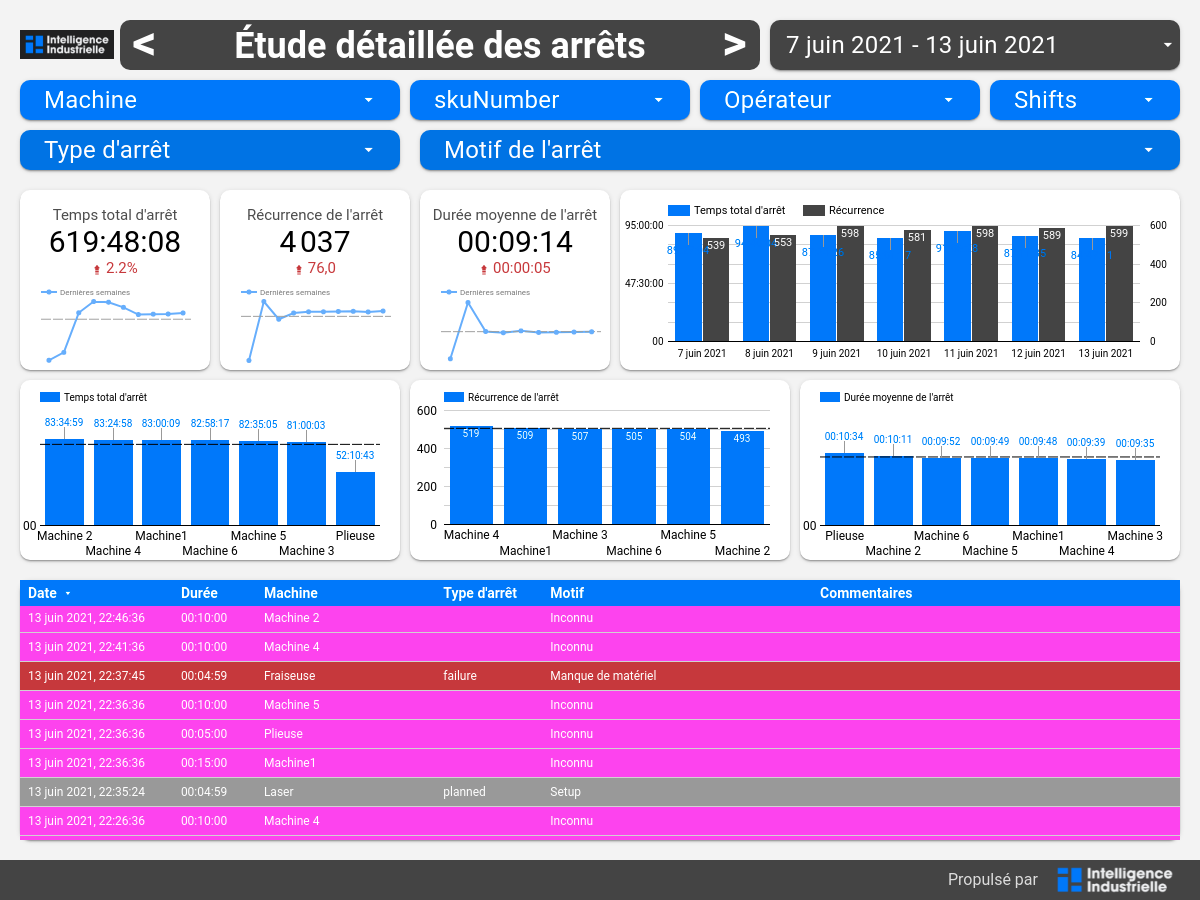
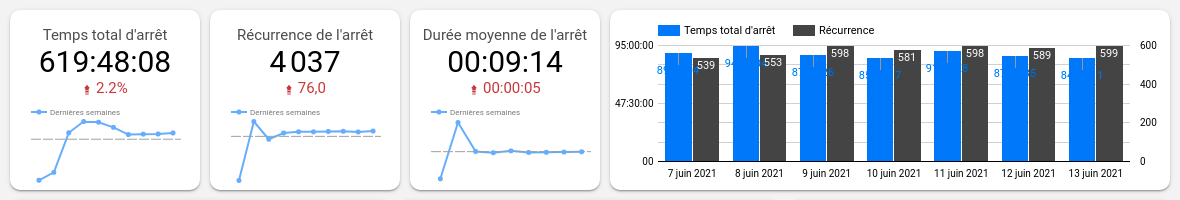
In the top part, there are three indicators for the time period selected in the filter:
- The amount of downtime
- The number of occurences of downtime
- The average duration of a stop
For each of the indicators, there is a progress index, which shows whether the value has increased or decreased compared to the previous time period. The graph displays the time and the number of occurence of stops for each day.
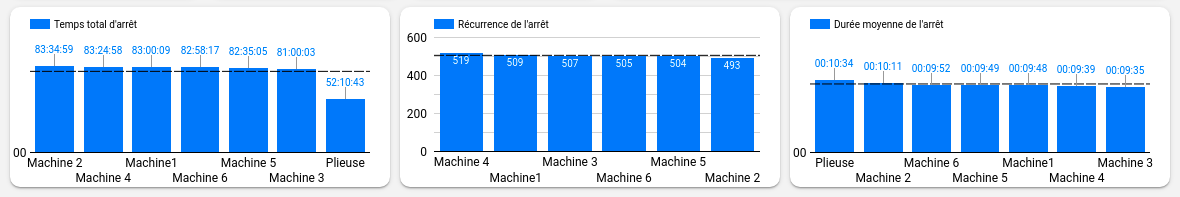
In the center, the three graphs show for each machine:
- The total downtimes
- The total number of stops
- The average duration of a stop
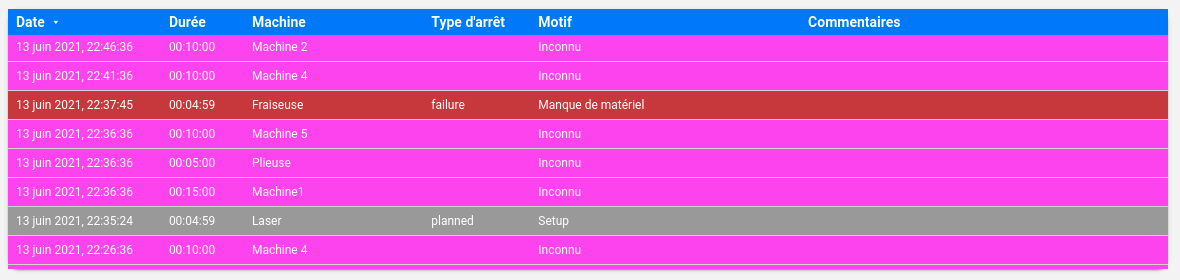
In the bottom part, there is a list of the stops in the selected time period. The information displayed is the date, the duration, the name of the machine, the stop cause type, the stop cause and the comment.