Introduction
Since dashboards and top views are made for real-time and/or very recent data, the report is made to visualize data over longer periods of time, such as days, weeks and months.
As you can see on the image below, the report is easily accessible from the homepage.
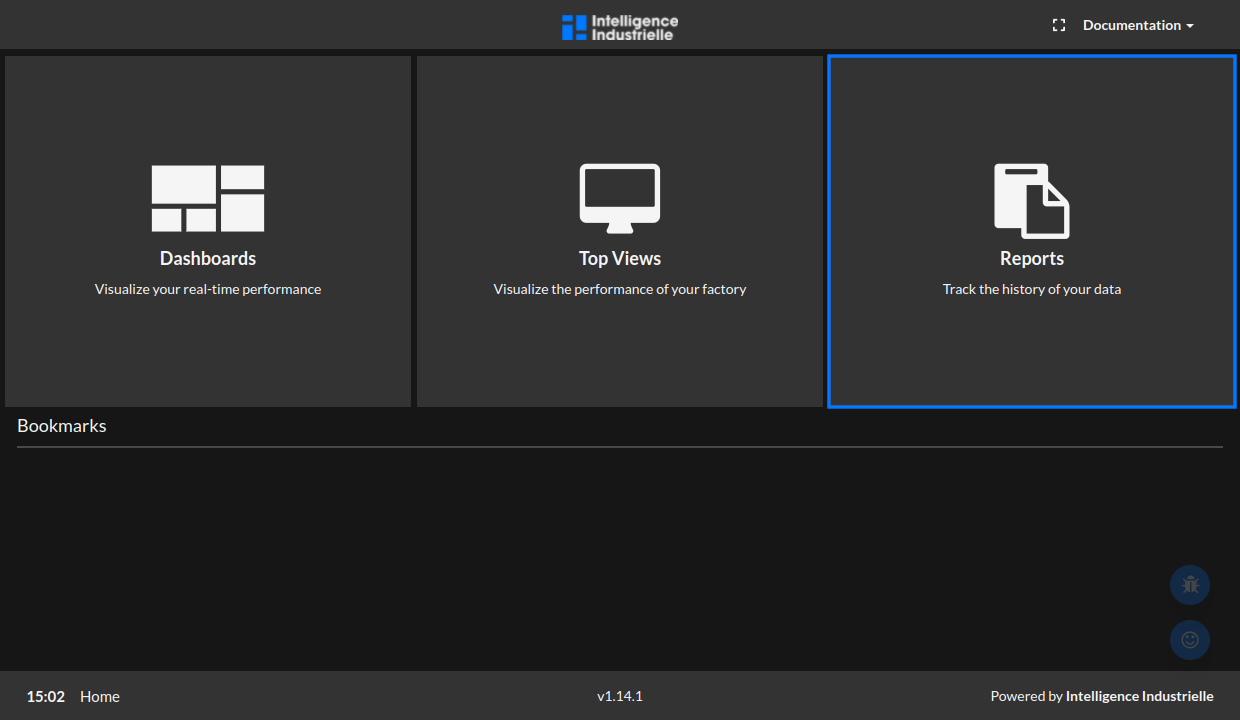
In this section, we will take an in-depth look at each of the 6 pages of the report and how the information can help you discover trends and improve productivity in your factory.
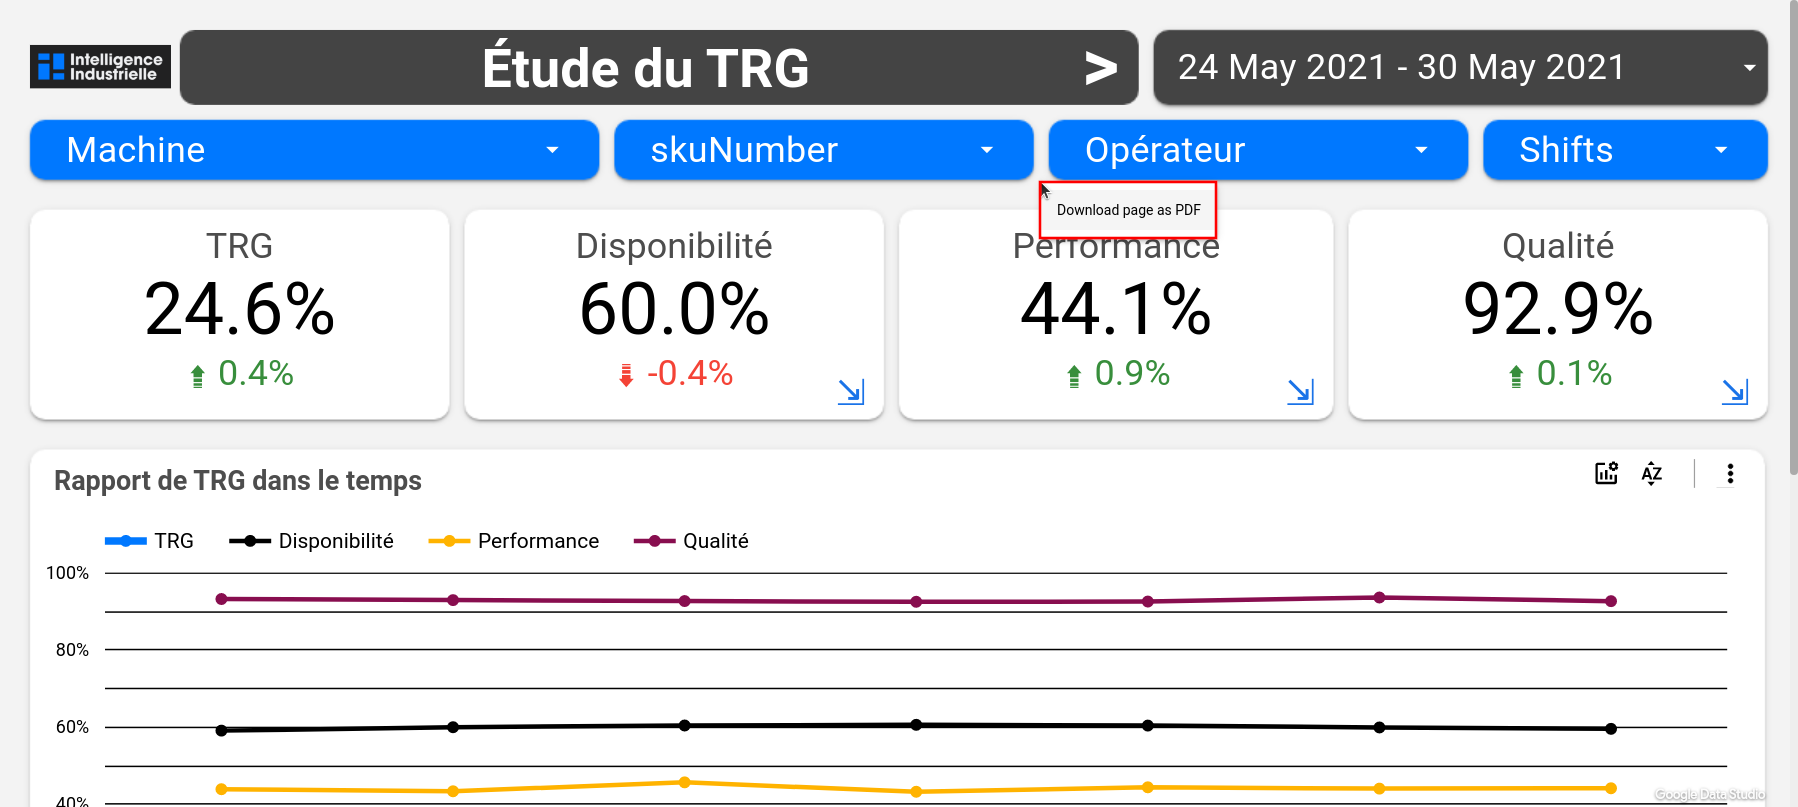
Filters
The report header displays the page name and the time period over which the data is filtered. The arrows next to the page name can be used to navigate from page to page.

At the top of the page, in blue, are the filters.

On all pages of the report, it is possible to filter the data on the page according to your machines, your production numbers (SKU numbers), your operators and your shifts.
Download your Report
Just before we examine each page of the report, know that you can download your report by right-clicking on it and select Download page as PDF. You can then select if you want specific pages or all pages.