OEE
Overall Equipment Effectiveness
The OEE is the main productivity indicator for a factory. It is the combination of availability, performance and quality. For more information about these indicators, please go to this page.
The OEE report page looks like this:
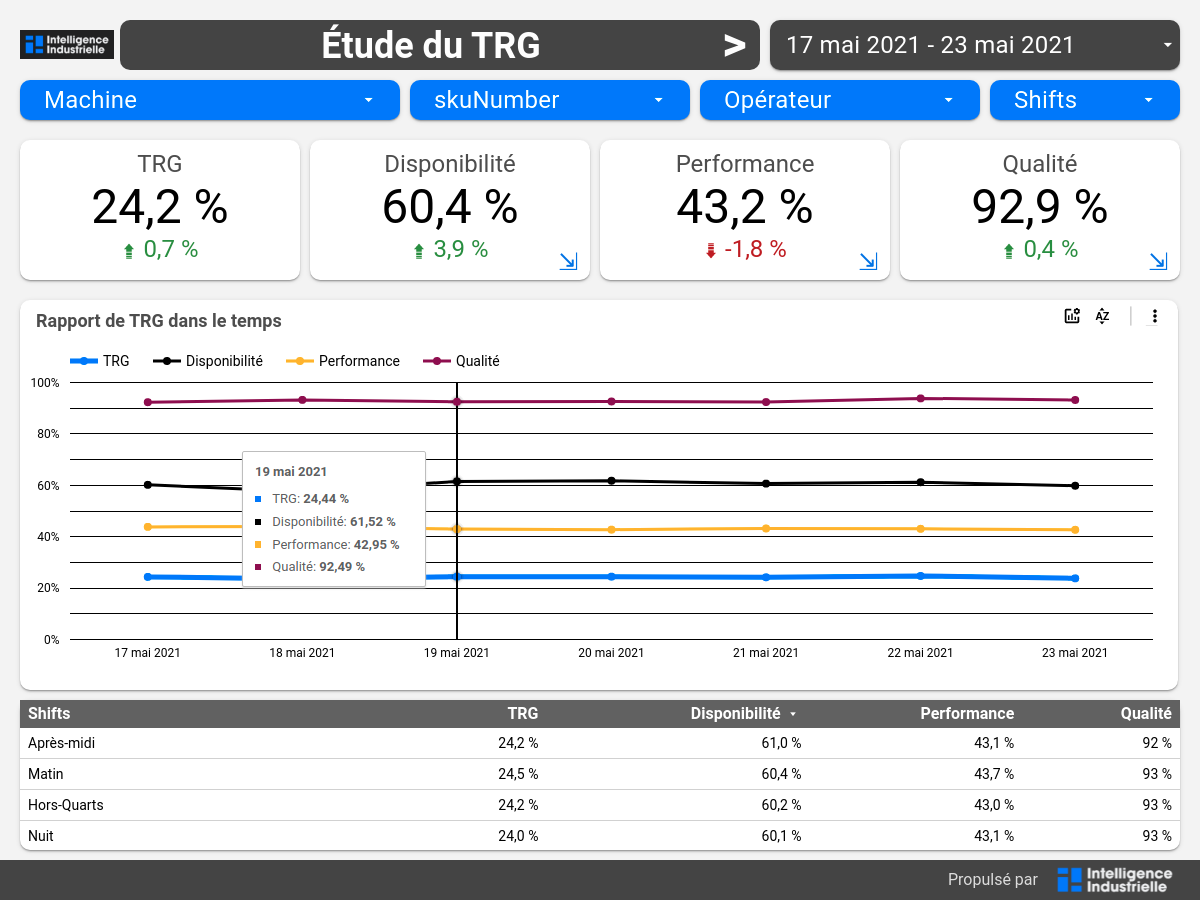
Just below the filters are the OEE, availability, performance and quality, calculated according to the filters selected above.
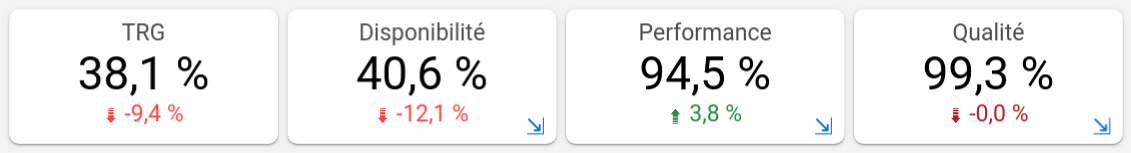
For each of the indicators there is a progress index, which shows whether the value has increased or decreased compared to the previous time period. For example, if your data is filtered for the week of May 16-22, then the progress index will compare to the value for May 9-15. The blue arrow in the lower right corner of the availability, performance and quality indicators is a shortcut to the corresponding report page.
A graph shows the evolution of OEE, availability, performance and quality over time. Move your cursor in the graph to get a more precise overview of a particular day.
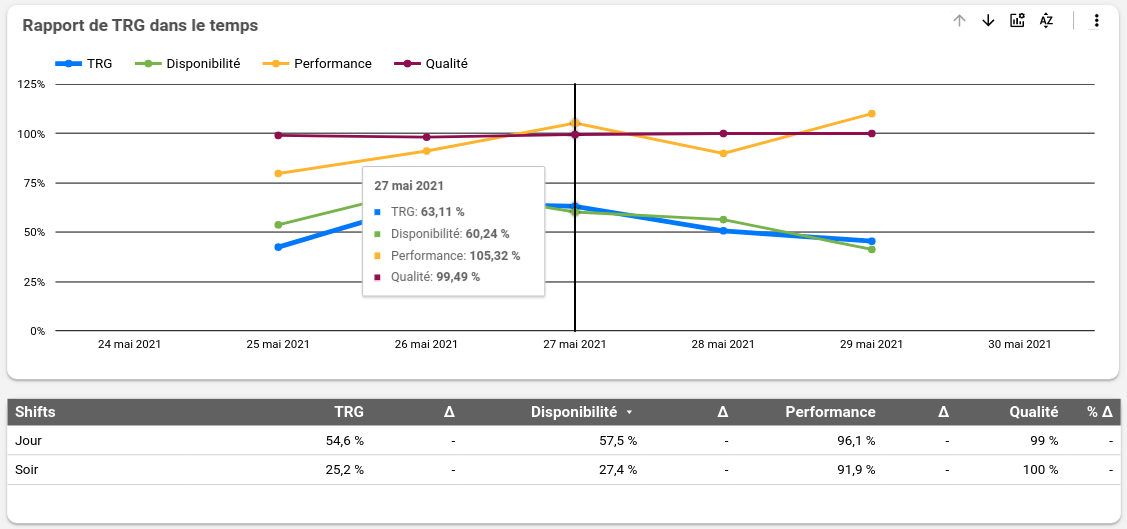
Finally, a table breaks down the same four indicators according to your shifts to give you another perspective on your data.